i.e. experts/specialists and raw data (raw data): how to transform process data into Analytics.
What is the obstacle to extracting information from plant data?
The first concern of those who have to think about system data is usually to understand where they are and how it is possible to collect them in a timely, reliable and secure manner.
Here then it turns out that most of the production and plant data are already available on the PLCs and SCADAs that have been installed for some time: "dormant" data, sometimes never consulted, coming from sensors distributed on machinery and production lines. Time-series of data (time-series, as the abscissa axis of the graph is almost always time), raw-data (raw data), which are just waiting to be collected and stored in specially designed and developed repositories (databases) to "historicize" all the values of the sensors distributed on the system: a Historian!
But time series analysis of data from a process plant sometimes cannot take place effectively until the data is cleaned by experts/specialists herein we will refer to them as SMEs (Subject Matter Experts).
Simply put, the raw data is there but it may not be ready for analysis and to deliver the desired benefits.
Some companies report that over the 70% of analysis time is spent cleaning data to take data from raw to “ready-for-analysis” data. This data is usually stored, sometimes in the cloud, a data lake or in historian, a historical repository of processes. (Incidentally, for all these options the costs are rapidly decreasing, and even Historians can reside in the Cloud).
Simultaneously, lower prices for sensors (both wired and wireless) are creating more data than ever before, which is then routed to Historian on-premises or in the Cloud.
And this creates a huge opportunity for plant operators and supervisors to leverage the data created by their processes and machinery, data that can also be invaluable for Quality and Compliance purposes. But it also leaves a gap, commonly referred to as "data rich, information poor", i.e. we have a lot of data, but we are left with little information, because we are unable to extract it effectively.
SMEs with knowledge of the process will therefore need to cleanse, shape and contextualize the data before starting the analysis.
Additionally, Data Scientists sometimes fail to run their algorithms until the data is “ready”: for all their experience in algorithms, Data Scientists often lack plant or process experience to know what to look for. in the data.
But SMEs are not data custodians, so one must first tackle monotonous and time-consuming tasks of accessing, cleaning and contextualizing data for analysis, looking for better solutions.
Advanced applications are required
While the goal of the analysis is to gain insights, this must be done in the context of the organization's data security requirements. For this there are rules and processes expressed in company data governance protocols to allow access to data only by authorized persons.
Therefore, any advanced analytics application used to manipulate data must adhere to rules and processes, and when collecting data from manufacturing facilities, it is essential that process data remain stored in its native form without any cleaning or aggregation. This is because even a small mistake of even a minimal modification of a data before performing the analysis could have a negative impact or reduce the opportunity for future insights.
Therefore, the transformation of data from “raw data” to “ready data” shouldn't happen before archiving the data to be done with a good Historian.
Later SMEs may also use spreadsheets (such as MS Excel) to 'clean up the data', but these general purpose tools are often not suitable for this task. This results in many looking to use spreadsheets for data cleansing and contextualization, a slow and manual process.
Traditional BI (business intelligence) applications are great for relational datasets, typical of the IT world, but even they don't scale to the dynamic nature of data time series, typical of a Historian used in the OT. There are today much more powerful, agile and easy to use tools, such as Historian for example.
For example, Historian allows you to address the fundamental issues of time series data, such as time zones, daylight saving time and the types and logic of interpolation must be set by the user in spreadsheet formulas. Done simply in Excel, on your desktop it may not be discoverable by colleagues, resulting in work having to be done over and over again. The result is not just hours spent in SMB spreadsheet hell, but sometimes even days, weeks, or months.
And these problems drive companies to look for a better solution in the form of advanced analytics applications.
Contextualize for analysis
Contextualization comes into play when SMEs prepare data for analysis by integrating and aligning data from multiple sources: this is called data harmonization, data blending, data fusion, or data augmentation.
Basically, the SMEs build a model, with the different types of data, to have a complete model of the asset or process, also combining elements that come from different sources such as data from external sensors, what the plant or process stage at that moment and which parts of the data may be most important to Operations.
And it's a growing challenge as process manufacturing companies generate more and more data: 1 TB/d (terabytes per day) for an average plant to even 40 TB/d for a company with multiple plants (see Figure 1 ) – and this only to record temperatures, pressures, flow rates, levels and other parameters of interest.

Let's look at a specific example, typical when working with time series of process data.
A dataset from a sensor that reports the value every second for a year results in a total of 3,1 million data points for the year, each in the form timestamp:value.
In most cases it is not possible to review all of this data, nor may it be necessary.
Indeed, SMEs in general would like to evaluate only specific ranges of interest within this yearly data set.
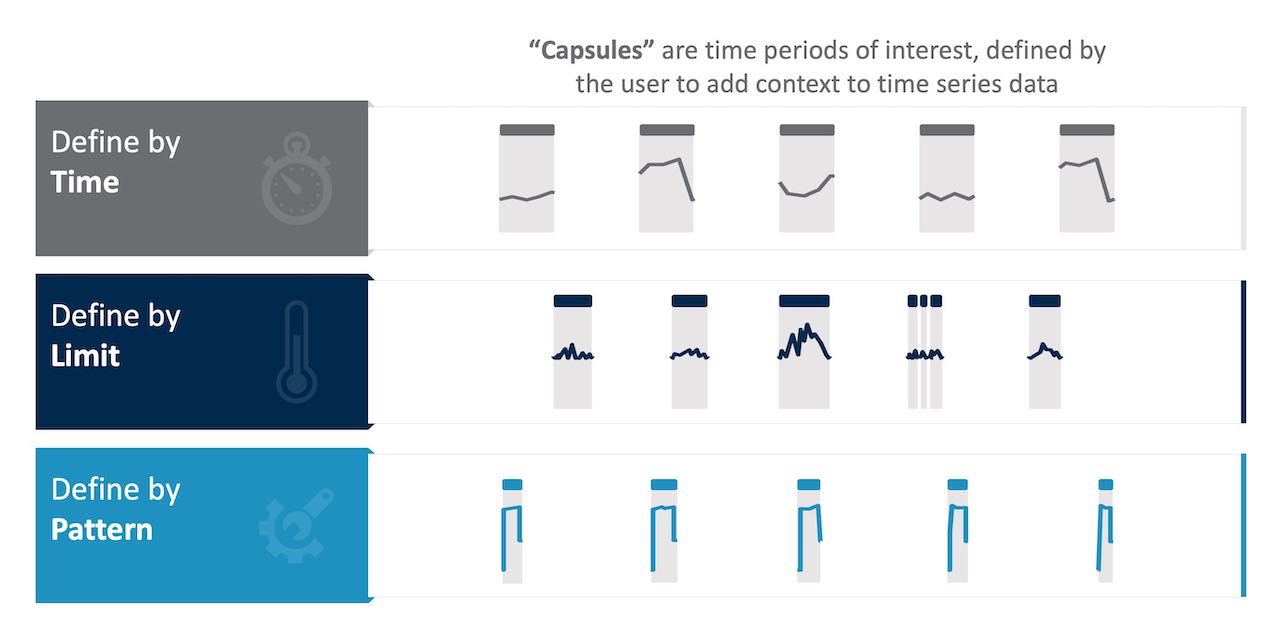
Here are some examples of what they might be interested in, with data only examined for analysis when the following conditions are true and ignored otherwise (see Figure 2):
- Time period: per day, per shift, Wednesday, weekdays vs. weekend or whatever
- State of the plant/production phase: on, off, in heating, stopped or other
- A calculation: periods of time in which the second derivative of the moving average is negative
- Faulty data samples due to lost signals, micro-stops, rejects, out-of-spec or other issues, all of which require cleaning to improve analysis accuracy.
What is evident from this example is that even for just one year of recorded data from just one signal, there are virtually unlimited ways to evaluate the data for analysis.
There is also a clear need for SMEs to choose the time intervals of interest wisely when transforming data to make it ready for further analysis.
Some manufacturing environments, such as a chemical plant, may have 20.000 to 70.000 signals (or sensors), oil refineries may have more than 100.000, and the sensor signals of a multinational corporation with several plants may reach millions of data points.
The amount of data then can be huge, but refining and reducing it can definitely lead to faster insights (see Figure 3).

Another obstacle to consider when preparing time series data for analysis is the interpolation and computation often required for data analysis, which can be ignored by IT data consolidation and aggregation methods. In fact, specific solutions for production data, such as Historian, are needed because they provide the ability to align signals with different sample rates, from different data sources, in different time zones. These and other data cleansing activities are undoubtedly necessary before defining the time periods of interest to analyze.
The contextualization phase
One way to expand operational data gathered from time periods of specific interest is to contextualize it with data from other sources to improve the impact on overall results.
When combining different data sources, common questions can be for example:
- What is the energy consumption when making product type 1 versus product type 2?
- What is the impact of temperature on product quality?
- Does the power consumption change as the batch completion time varies?
Some examples of common data sources include LIMS (laboratory information systems), MES (manufacturing management systems), ERP (enterprise resource planning systems), raw material price quotation, utility rates, and more.
Here is an example of the data contextualization required to aggregate and work with data from multiple sources.
The result is a table (Figure 4) easy to understand and manipulate. It is also accessible to SMEs, along with analysts using business intelligence applications such as Microsoft Power BI, Tableau, Qlik, etc.

Look inside time series data
Advanced time-series data analysis applications are easier to use, in stark contrast to the analytic efforts required by traditional spreadsheets, allowing SMEs to quickly cleanse and contextualize the data to be analysed.
With these types of applications, data can be accessed directly from historian or from silos as required by regulatory bodies and are not copied or duplicated, thus preserving the "Data Integrity" and is therefore used for diagnostic, predictive analysis and analytics in general.
Advanced analytics applications enable collaboration among colleagues, through reports and dashboards that are public and accessible for insights to everyone involved in the Company, without the need to browse hundreds or thousands of rows in spreadsheets. With advanced analytics applications, you can quickly gain insights that businesses can gain by extracting value from time-series data, making this data as easy to analyze as it is to collect and store.
Conclusion
Today there is a lot of attention on digital transformation and how it is possible to use information from plants to better manage production departments and industrial companies, and this attention makes it more important than ever to understand the importance of correct data cleansing and contextualization of the time series of data with all the other data available from each source.
But let's remember that at the basis of all possible analyses, there is the need to collect data from the plant in a timely, reliable and secure manner, accumulating all the values in suitable repositories, which can guarantee the performance required by the analysis applications .
Webgraphy:
How raw data is made ready for applying analytics
Seeq.